Community survey

Beginning in the summer of 2014, CBFC volunteers conducted a survey to assess community members’ potential interest in a food coop and to better understand their grocery shopping needs.
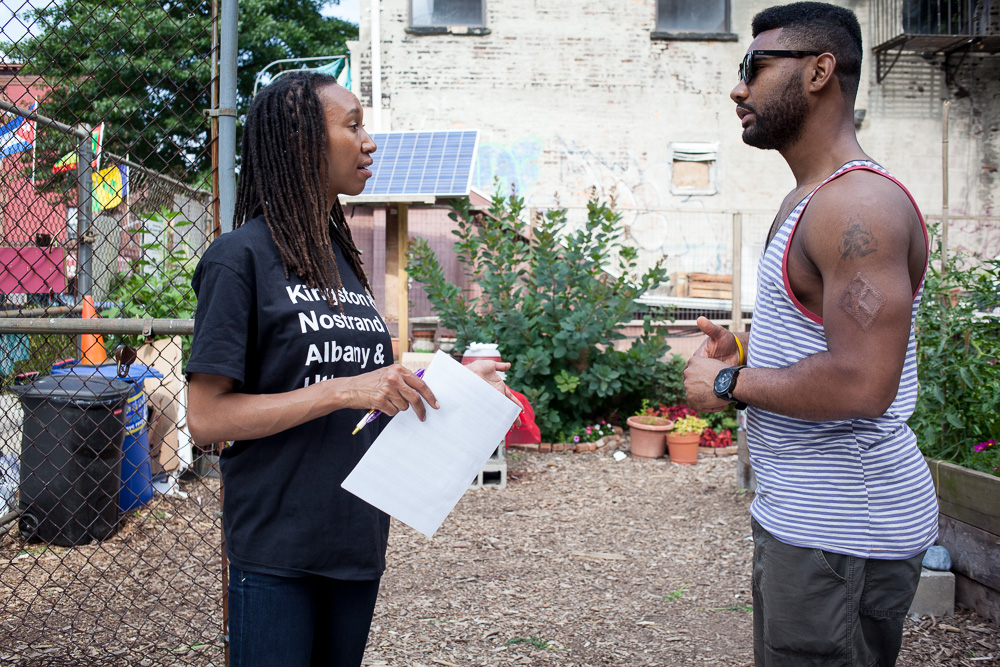
A CBFC volunteer with a clipboard surveys a resident in a community garden in Central Brooklyn, summer 2014.

We aimed to document the demographics of respondents, as well as their willingness to join a coop, satisfaction with their normal grocery store, and typical buying habits. We successfully surveyed 346 residents both in-person and online. We hope to use the data we gathered to inform the development of our membership structure and the products the coop will offer.
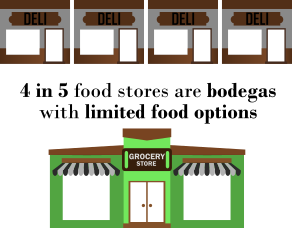
Four in five food stores in the area are bodegas with limited food options.
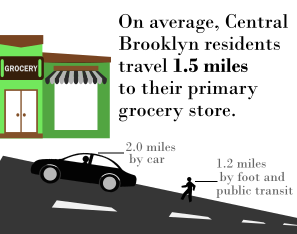
On average Central Brooklyn residents travel 1.5 miles to their primary grocery store: 2.0 miles by car and 1.2 miles on foot or by public transit.
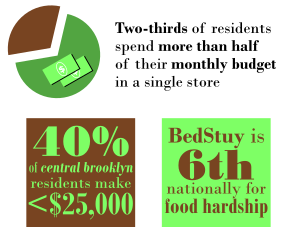
Two-thirds of residents spend more than half of their monthly budget in a single store. Forty percent of Central Brooklyn residents make under $25,000, and Bed-Stuy ranks 6th nationally for food hardship.
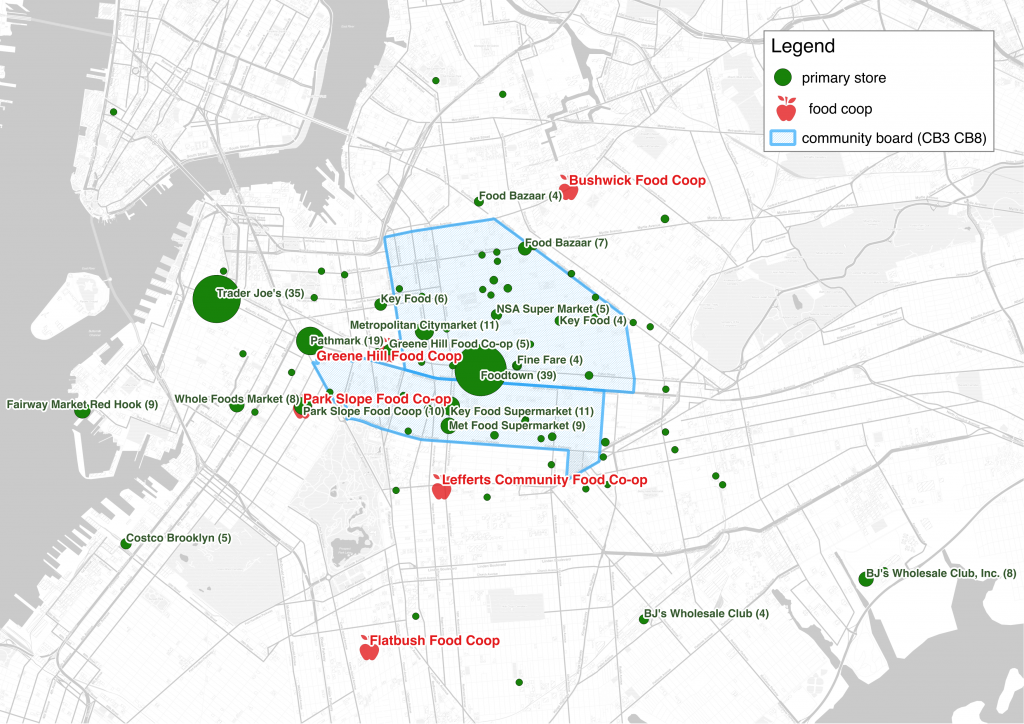
Map of Brooklyn plotting the primary grocery stores residents named against the borough's food co-ops, with the Community Board 3 and 8 boundary outlined. No food co-op falls inside it.
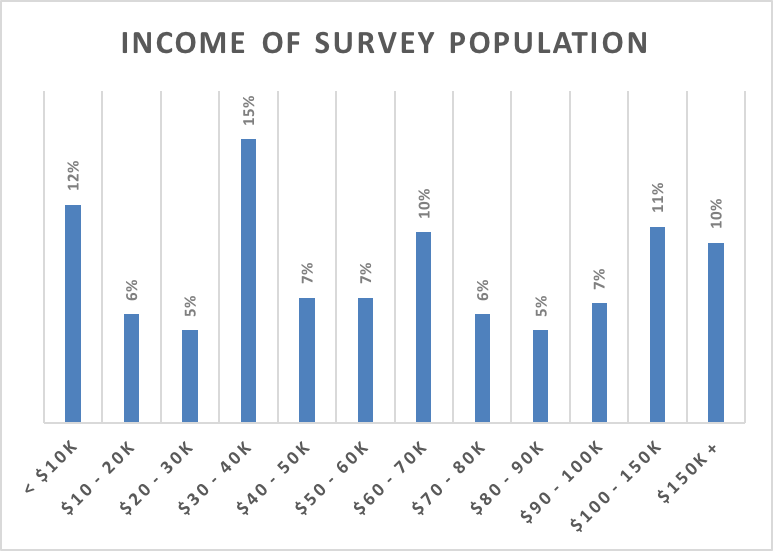
Bar chart of the income of the survey population across twelve brackets, from under $10,000 to $150,000 and above. The largest group, 15 percent, earns $30,000 to $40,000.
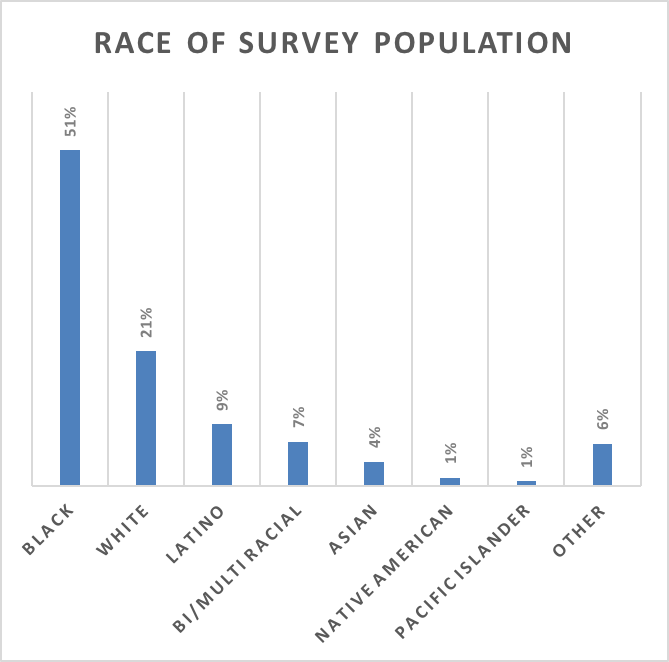
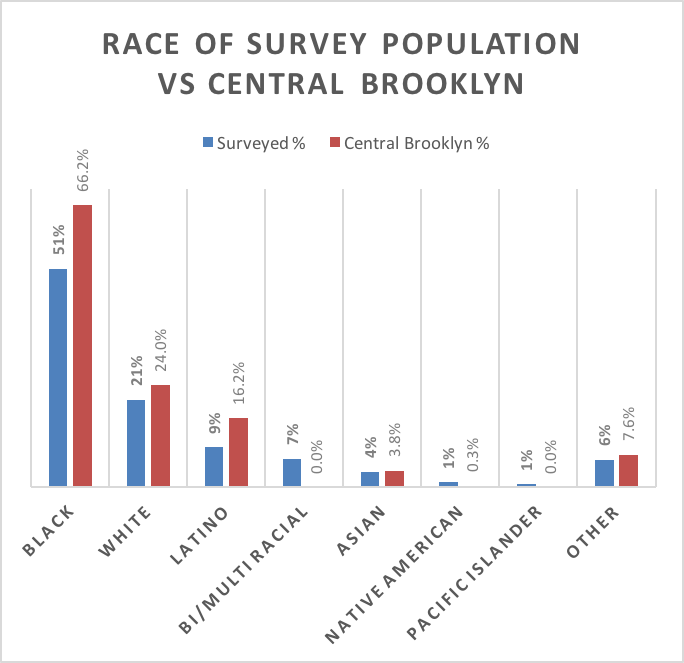
Bar chart of the race of the survey population: Black 51 percent, white 21 percent, Latino 9 percent, bi or multiracial 7 percent, Asian 4 percent, Native American 1 percent, Pacific Islander 1 percent, other 6 percent.
Bar chart comparing the race of the survey population with Central Brooklyn as a whole. Black residents are 51 percent of those surveyed against 66.2 percent of Central Brooklyn.

Graphic and photo credit to Murray Cox